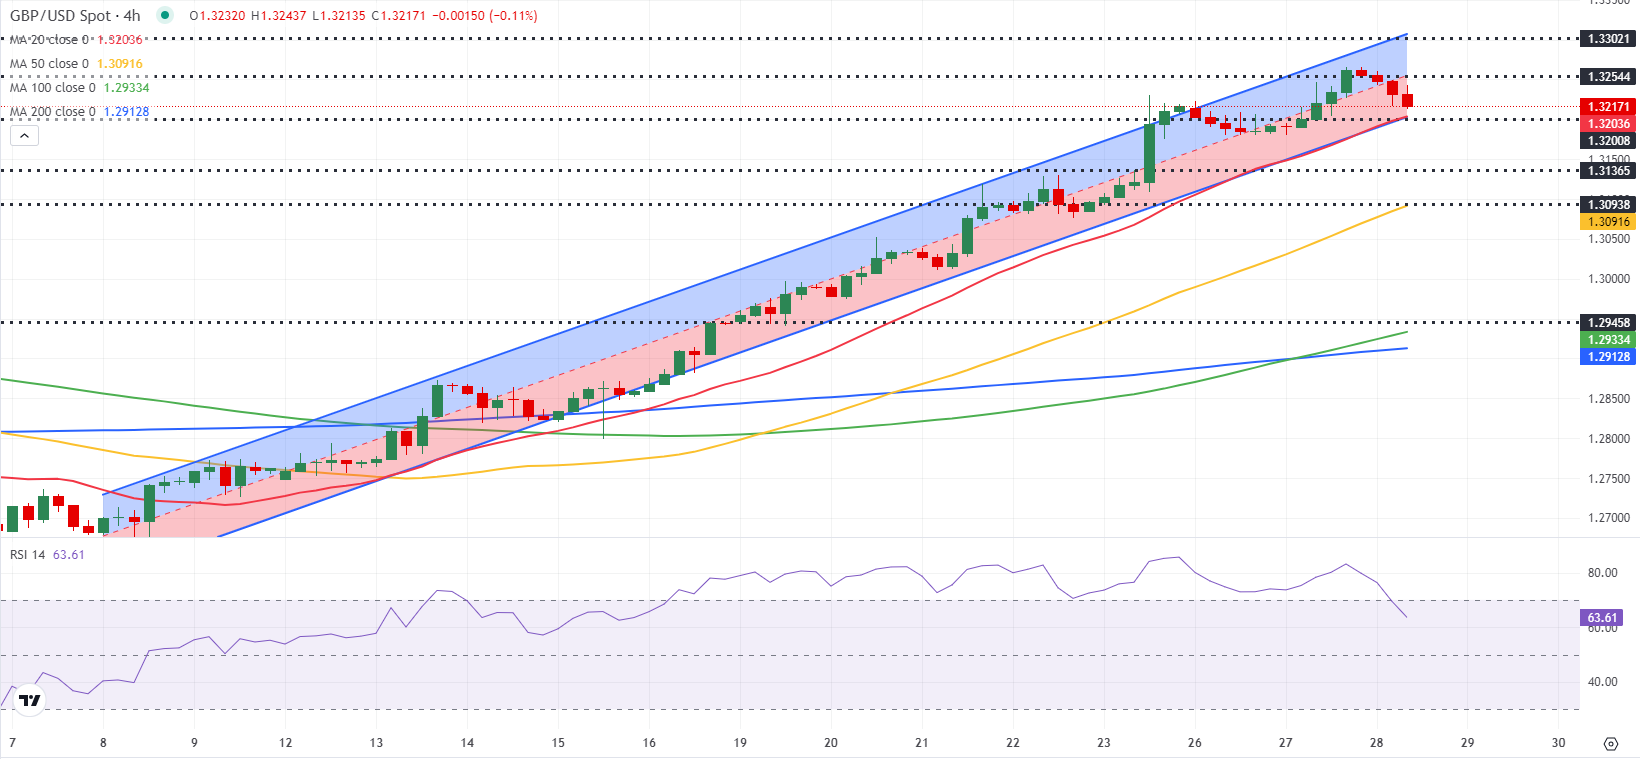
GBP/USD experienced a correction after reaching a 29-month high on Tuesday, potentially extending further if support at 1.3200 fails. With no major data releases scheduled for Wednesday, investors are closely monitoring the pair’s technical outlook.
British Pound PRICE Today
The table below displays the percentage change of the British Pound (GBP) against major currencies today, with GBP being weakest against the US Dollar.

Following a quiet European session, GBP/USD saw gains in the second half of Tuesday, supported by improved market sentiment. US stock index futures are trading flat on Wednesday, offering little insight into overall market risk appetite.
Looking ahead, the US Bureau of Economic Analysis will release the second estimate of second-quarter GDP growth on Thursday, along with weekly Initial Jobless Claims data. Friday will bring key inflation data with the Personal Consumption Expenditures (PCE) Price Index.
GBP/USD Technical Analysis
The Relative Strength Index (RSI) on the 4-hour chart has dropped below 70 for the first time in over 10 days, indicating a potential correction. Immediate support lies at 1.3200, with further levels at 1.3140 and 1.3100. Resistance levels include 1.3250 and 1.3300.
Pound Sterling FAQs
Learn more about the Pound Sterling, its history, monetary policy influences, and how economic data releases can impact its value.
Analysis:
The GBP/USD pair experienced a correction after reaching a 29-month high, with investors now focusing on technical support levels. As economic data releases and market sentiment continue to drive price action, understanding the technical analysis and key support/resistance levels can help traders navigate potential opportunities in the currency market.

