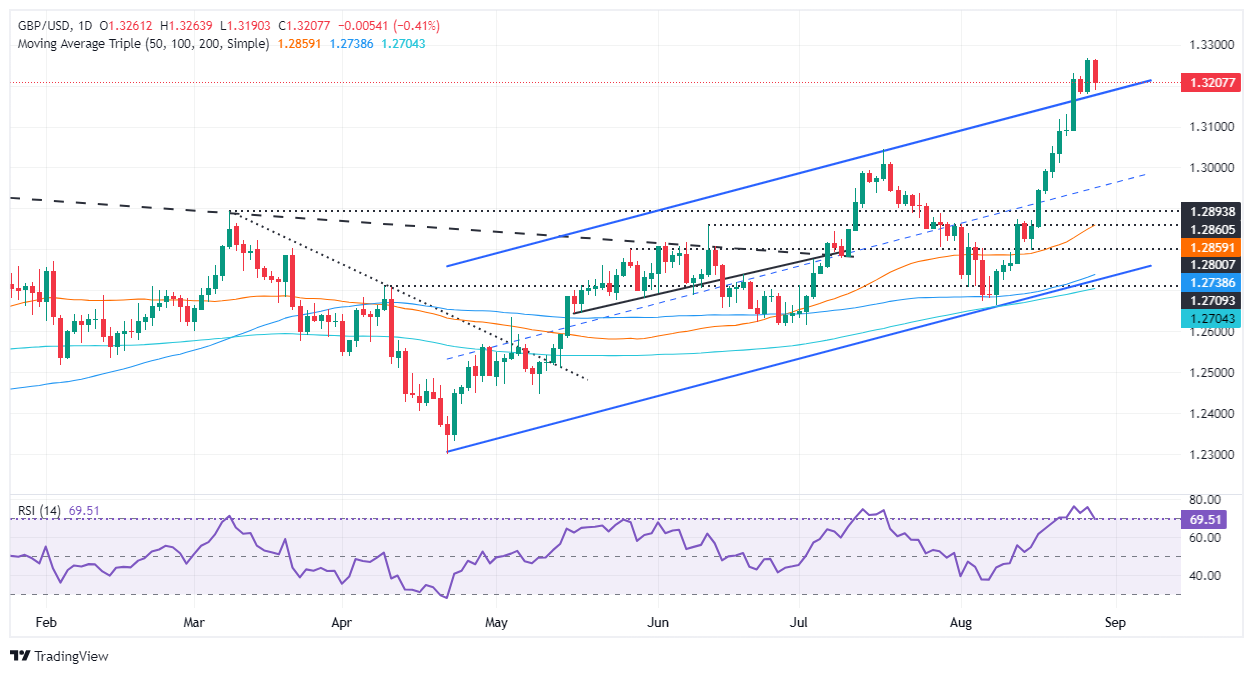
The GBP/USD pair is facing resistance above the year-to-date high of 1.3266 as the Pound Sterling retraces from its recent multi-year highs. With the Relative Strength Index (RSI) signaling overbought conditions, a retracement may be on the horizon. However, if the pair manages to reclaim the 1.3266 level, the uptrend is likely to resume.
Technical Analysis and Price Forecast
Looking at the daily chart, the GBP/USD pair remains in an uptrend as long as it stays above the top trendline of the ascending channel. The RSI turning overbought suggests that a pullback may be imminent before the pair attempts to move higher. If the pair breaks above 1.3266, it could target the March 23, 2022 peak at 1.3298. Further upside potential exists towards 1.3400 and 1.3437 levels.
On the downside, a drop below 1.3200 could lead to a retest of the recent cycle high at 1.3044, followed by a potential decline towards the 50-day moving average at 1.2857.
Analysis of GBP Performance Against Major Currencies
The British Pound has shown strength against major currencies today, with notable gains against the Euro. The table below displays the percentage change of the GBP against various currencies, highlighting its performance in the market.

Overall, the GBP/USD pair faces key resistance levels and potential support zones based on technical analysis. Traders and investors should closely monitor these levels to make informed decisions regarding their positions in the market.

